Digital History  ·  June 2026
Ananya Besufekad
Bank of England  ·  1847 – 1996
A financial crisis becomes public as a headline.

But in the City of London, some actors moved before the headline arrived.

Did the Bank of England operate through an open market, or through a closed access network?

Bank records · earlier Public headline · later
The British Access Network
Bank of England crisis access · bill brokers to authorised counterparties
Scroll to follow the trail
01 — The research question

Across Britain's crises from 1847 to 1996, did the Bank of England manage financial stress through an open public market — or through a narrow recognised access network?

The whole project turns on that one distinction. To answer it, the paper asks three smaller questions, each tied to a different period and a different test.

Q1

Was there a Victorian inner circle?

Did a stable set of intermediaries sit at the front of the crisis information chain in the Victorian period, closest to the Bank?

1847 – 1890
Q2

Did the telegraph break it?

Did the 1866 transatlantic cable, which made prices travel faster, shrink that advantage and open access to the Bank?

1857 vs 1907
Q3

Did the structure survive?

Did the access network outlast the First World War, from Victorian bill brokers to later authorised money-market counterparties?

1914 – 1997
02 — Why this matters

Not just a banking question. A question about power, information, and access.

If markets were becoming modern and efficient, we might expect access to the Bank to grow more open over time. But if London finance stayed a closed access network, then modernity did not simply mean democratization. It meant older elite relationships were formalized into institutional rules.

If it were an open market
Bank

Anyone could reach the Bank directly. Access widens and diffuses. Crisis support is a public facility, open on equal terms.

vs
If it were an access network
Bank

A recognised gatekeeper layer rings the Bank. The wider public sits outside it. Crisis support flows through known intermediaries.

03 — The scholarly debate

Two ways of reading financial crises.

The project enters a real disagreement. One tradition sees finance as shaped by elite networks and private access. Another sees information becoming faster and markets becoming efficient. The paper takes both seriously.

Side A

The closed access club

Finance was shaped by elite networks, private information, and privileged access.

Hopkins (1988)

"Gentlemanly capitalism": a London elite whose advantage was relational, built on geographical location and social ties.

Amini & Toms (2021)

Interlocking directorates worked as private information conduits, giving some directors a better informational advantage.

Gorton & Ordoñez (2014)

The theory that a crisis is fundamentally an information event, where who knows what, and when, matters.

Flandreau & Ugolini (2011)

Victorian crisis liquidity ran through the discount-house and bill-broker layer, with privileged access to the Bank.

Side B

The efficient, faster market

Information became faster, prices became efficient, and simple insider-profit stories can be myths.

Hoag (2006) · Richmond Fed (2018)

The 1866 cable cut the London to New York information lag "from ten days to zero" and compressed price gaps from 5–10% to 2–3%.

Schneider (2022)

The Bank's 1866 lending was politically negotiated and deliberately ambiguous, not a transparent public rule.

Rothschild Archive (2014)

The famous insider-profit legend is "more legend than fact", a caution against assuming early access became profit.

The lesson

Measure dated visibility and access. Never assume foreknowledge or profit.

The turn

Maybe both are true. Prices became faster — but access to the Bank remained mediated.

Price information and institutional access are two different things. The cable settled the first. This project tests the second.

04 — The actors

The project follows actor types, not abstract data.

A crisis is easier to understand as a small cast of institutions than as a wall of numbers. The Bank of England sits at the centre. Around it are the firms that could reach the Bank, the banks that funded them, the press that made stress public, and the wider public that usually learned last.

Bank of England Bill brokers Discount houses Merchant / acceptance Clearing banks Specialist City press Newspapers · Hansard The wider public Authorised list · 1996
The spine · 1830s – 1997

Discount houses

They buy and hold short bills, funded by overnight money lent by the banks. The same role runs down the middle of the whole story: the bill broker the Bank gave a facility to in 1830 becomes the authorised counterparty of 1996.

Revealed by · BoE transaction ledgers + the 1967 discount-market history
The original intermediaries · early 19th c.

Bill brokers

They matched lenders and borrowers of short IOUs, called bills of exchange. They are the ancestors of the discount houses and the first firms the Bank dealt with on a recognised footing.

Revealed by · ledgers + the 1906 bill-market reconstruction
The screeners · 19th c. – 1930s

Acceptance houses

Also called merchant banks. They guarantee, or "accept", a bill for a distant borrower, lending their name rather than their cash. They vet borrowers and form part of the recognised layer.

Revealed by · the 1914 ledger + the 1906 bill reconstruction
The recognised core · 1900s onward

Clearing banks

Large ordinary deposit banks that supply call money to the discount houses and later partner in rescues. They fund the network and help organise support.

Revealed by · Römer's 1931 study + the 1978 lifeboat account
The insider clock · Victorian – interwar

Specialist City press

The Bankers' Magazine and similar titles reported money-market strain for professionals. They show stress was legible to insiders before it reached the public.

Revealed by · The Bankers' Magazine
The public clock · every period

Newspapers & the public

HMD newspapers and Hansard form the broad public record. This is the comparison point the whole argument turns on: the moment a crisis became visible to everyone.

Revealed by · HMD newspapers + Hansard
05 — The evidence chain

How the project knows anything.

No single record proves the argument. Each source answers one question and stays silent on others. The pattern appears only when they are linked in order, which is what makes this digital history.

01

Bank ledgers

Shows who reached the Bank's window, by name and amount.

Cannot show what anyone privately knew.

→
02

Bank Rate

Dates the Bank's earliest defensive signal, day by day.

Cannot show the market rates firms actually paid.

→
03

Press & Hansard

Dates when stress became speakable, to insiders then the public.

Cannot prove absence; scanning shapes the record.

→
04

Market prices

Tests whether early access showed up as visible profit.

Cannot see unlisted firms or private gains.

→
05

Bill-market & Bank histories

Maps the funnel and the long institutional lineage.

Institutional authorship; not an outside critique.

→
06

Discount-house database

Shows the layer still in active use up to 1997.

Sector aggregate; limited firm-level detail.

Read together, these answer one question each source cannot answer alone: not what anyone knew, but who could reach the Bank, and how early stress was visible.

06 — Three findings

What the evidence shows.

Part I
verified
01

A closed information and access club.

In the Victorian crises, the same kinds of intermediaries recur at the front of the chain, and the Bank's defensive signal appears before the public rupture in every case.

Telegraph
test
02

Faster prices did not open access.

The 1866 transatlantic cable made prices travel faster. It did not decide who could stand at the Bank's discount window. The insider-to-public lead grew rather than shrank.

Part II
verified
03

The network survived by changing form.

After 1914 the structure took a more formal shape. The Bank kept working through recognised intermediaries until 1997, when it widened to a larger defined list, not to the public.

A note on language. The project measures dated visibility, positioning, and institutional access. It does not claim that anyone knew a crisis in advance or profited from one.

07 — Method · why crises, and why these

Why study a system through its worst days?

It is a fair objection that crises are unusual. The reason to study them is that a crisis makes a hidden structure visible. In calm years the access network is quiet. A discount house rolls over its bills, a clearing bank lends spare cash overnight, a trusted firm gets credit because everyone knows its name. These relationships matter, but they rarely leave a dated public trace. A panic makes them loud.

In calm years

The wiring stays hidden

Access runs on trust and habit. It is real, and it shapes who gets credit, but it produces little that you can date or count from the outside.

a crisis lights it up
In a panic

The wiring lights up

The Bank's ledgers, its rate moves, its rescue operations, the newspapers and the official record all turn dense and datable at the same moment. You can finally see who reaches the Bank, who moves early, who is supported, and who is left outside the recognised layer.

The claim is not that the network existed only during panics. It is that a panic forces private relationships into the record. So a crisis works as a stress test that exposes the wiring, and comparing several of them lets us ask whether the same structure keeps reappearing.

So why these crises, and not others?

The cases were not chosen for drama or severity, and the paper does not claim they are the most severe. They were chosen to vary along the dimensions that matter for the question: period, crisis origin (home-grown or imported), the communication technology of the day, and above all what kind of evidence survives about who could reach the Bank. Each case has to clear three bars at once.

Criterion 01

Historically consequential

Each is named in the scholarly literature as a defining moment for the Bank's crisis role, so the comparison engages real cases other historians argue about, not convenient ones.

Criterion 02

Structurally distinct

The cases sit at different points on the map: home-grown bill-market collapse, imported transatlantic shock, single-firm rescue, war and payment rupture. If one Bank rule ran uniformly, their shapes would converge. They do not.

Criterion 03

Comparable evidence

Each appears in the daily Bank Rate and the public record, and most carry a deeper source — a transaction ledger, daily account books, or a recent archival reconstruction — so they can be set side by side.

The cases, what evidence each one carries, and the job it does in the argument
CrisisOriginWhat evidence it carriesRole in the argument
Part I · the press-and-telegraph era, 1847–1914 — who reached the Bank, and how early
1847home-grownTransaction ledger · firm-levelThe earliest named window: who stood at the Bank before the watershed of 1866.
1857imported · USTransaction ledger · firm-levelA pre-cable transatlantic shock; the baseline for the telegraph test.
1866home-grownTransaction ledger · firm-levelThe Overend panic, the case Bagehot was describing; the broadest window in the sample.
1873importedBank Rate · public recordIncluded where the evidence allows, and flagged as a weaker case with thin coverage.
1890home-grownDaily account books · no ledgerThe Baring rescue. It enters the lead-time comparison but not the firm-level recurrence, because no transaction ledger survives.
1907imported · USBank Rate · public recordA post-cable transatlantic comparison to 1857: did faster news shrink the lead? It grew.
1914external · warTransaction ledger (reduced)The latest ledger case, on the far side of the cable; tests whether the same firms recur.
Part II · did the structure survive? 1906–1997 — evidence shifts from ledgers to aggregates
1906prewar baselineBill-market reconstructionA calm-year snapshot of the access funnel just before 1914.
1931home-grownArchival reconstruction (Römer)The closest major post-1914 British crisis with a recent reconstruction of the Bank's operations.
1973–75home-grownOfficial BoE accountThe lifeboat: the major later British rescue, with named institutions and a vetted committee.
1976–96structuralBoE statistical databaseShows whether the recognised intermediary layer was still in ordinary use before reform.
1997the reformInstitutional recordsThe institutional break: the year the Bank stopped dealing exclusively with the discount houses.
And deliberately left out
  • 1825 — predates the 1844 Bank Charter Act regime and the weekly balance-sheet series the project relies on; no comparable transaction source.
  • 1878 · City of Glasgow Bank — recorded as a crisis the Bank quietly prevented; a prevented non-panic leaves almost no acute-window footprint to measure.
  • 1899–1902 · Boer War — war finance, a different analytical category from a lender-of-last-resort panic, and a faint crisis footprint in the balance sheet.
  • 1912–13 · Balkan Wars — part of the run-up to 1914 rather than a separate episode; the 1913 observations serve as the 1914 baseline.

Choosing structurally distinct cases on purpose commits the argument to a particular shape. It cannot be a tidy ranking of more or less modern rescues. It has to be that the form of the crisis shapes who can reach the Bank — and where a single uniform rule had operated, the measures across these cases would converge rather than diverge. With a dozen cases the paper compares structures and traces continuity; it does not claim a statistical law over all crises or all central banks. Full selection logic in docs/case_selection.md and §4–5 of the paper.

08 — Interactive · the crisis map

Where stress began, and who saw it first.

Some shocks were home-grown in London. Others arrived from abroad, most often from New York. Pick a crisis to trace its origin, the recognised actors positioned closest to the Bank, and the gap between market visibility and public information.

New York Continent London Discount houses Bill brokers Acceptance houses Clearing banks City press
London at the centre · recognised City institutions ringed around the Bank
1866
The Overend panic
Home-grown · London origin
Market signal Public rupture
Market visibility led public information by 288 days.
Earliest market signal
4 Mar 1866
Public rupture
11 May 1866
Lead time
288 days
Source used
BoE ledgers · Flandreau & Ugolini 2011
Actor types with early access

A long market build-up, then a sudden public rupture when Overend suspended.

Read as visibility and access, not foreknowledge. The dates mark when stress was measurable to the market versus when it became public, not what any person knew or did.

09 — Interactive · the information flow

In what order did stress reach each actor — and how much later the public?

Pick a crisis. The actors are laid out in the order trouble first reached them. For the three crises with surviving transaction ledgers (1857, 1866, 1914) that order is read straight from the Bank's own books: the date each kind of firm first appears at the discount window. Every link carries the gap in days. The same recognised layer keeps arriving first, and the wider public arrives last.

1866 The Overend panic
At the Bank's window — ledger order
Core layer · discount houses & bill brokers Recognised · acceptance, merchant & clearing Outer · foreign, colonial, industrial The wider public

Each link is a measured gap in dated records, not a claim about who knew what. Ledger order for 1857, 1866 and 1914 (BoE transaction ledgers); Bank-Rate-signal to public rupture for the crises without surviving ledgers. Computed in src/v7_flow_network.py.

10 — Interactive · network analysis

The recognised layer, drawn as a graph.

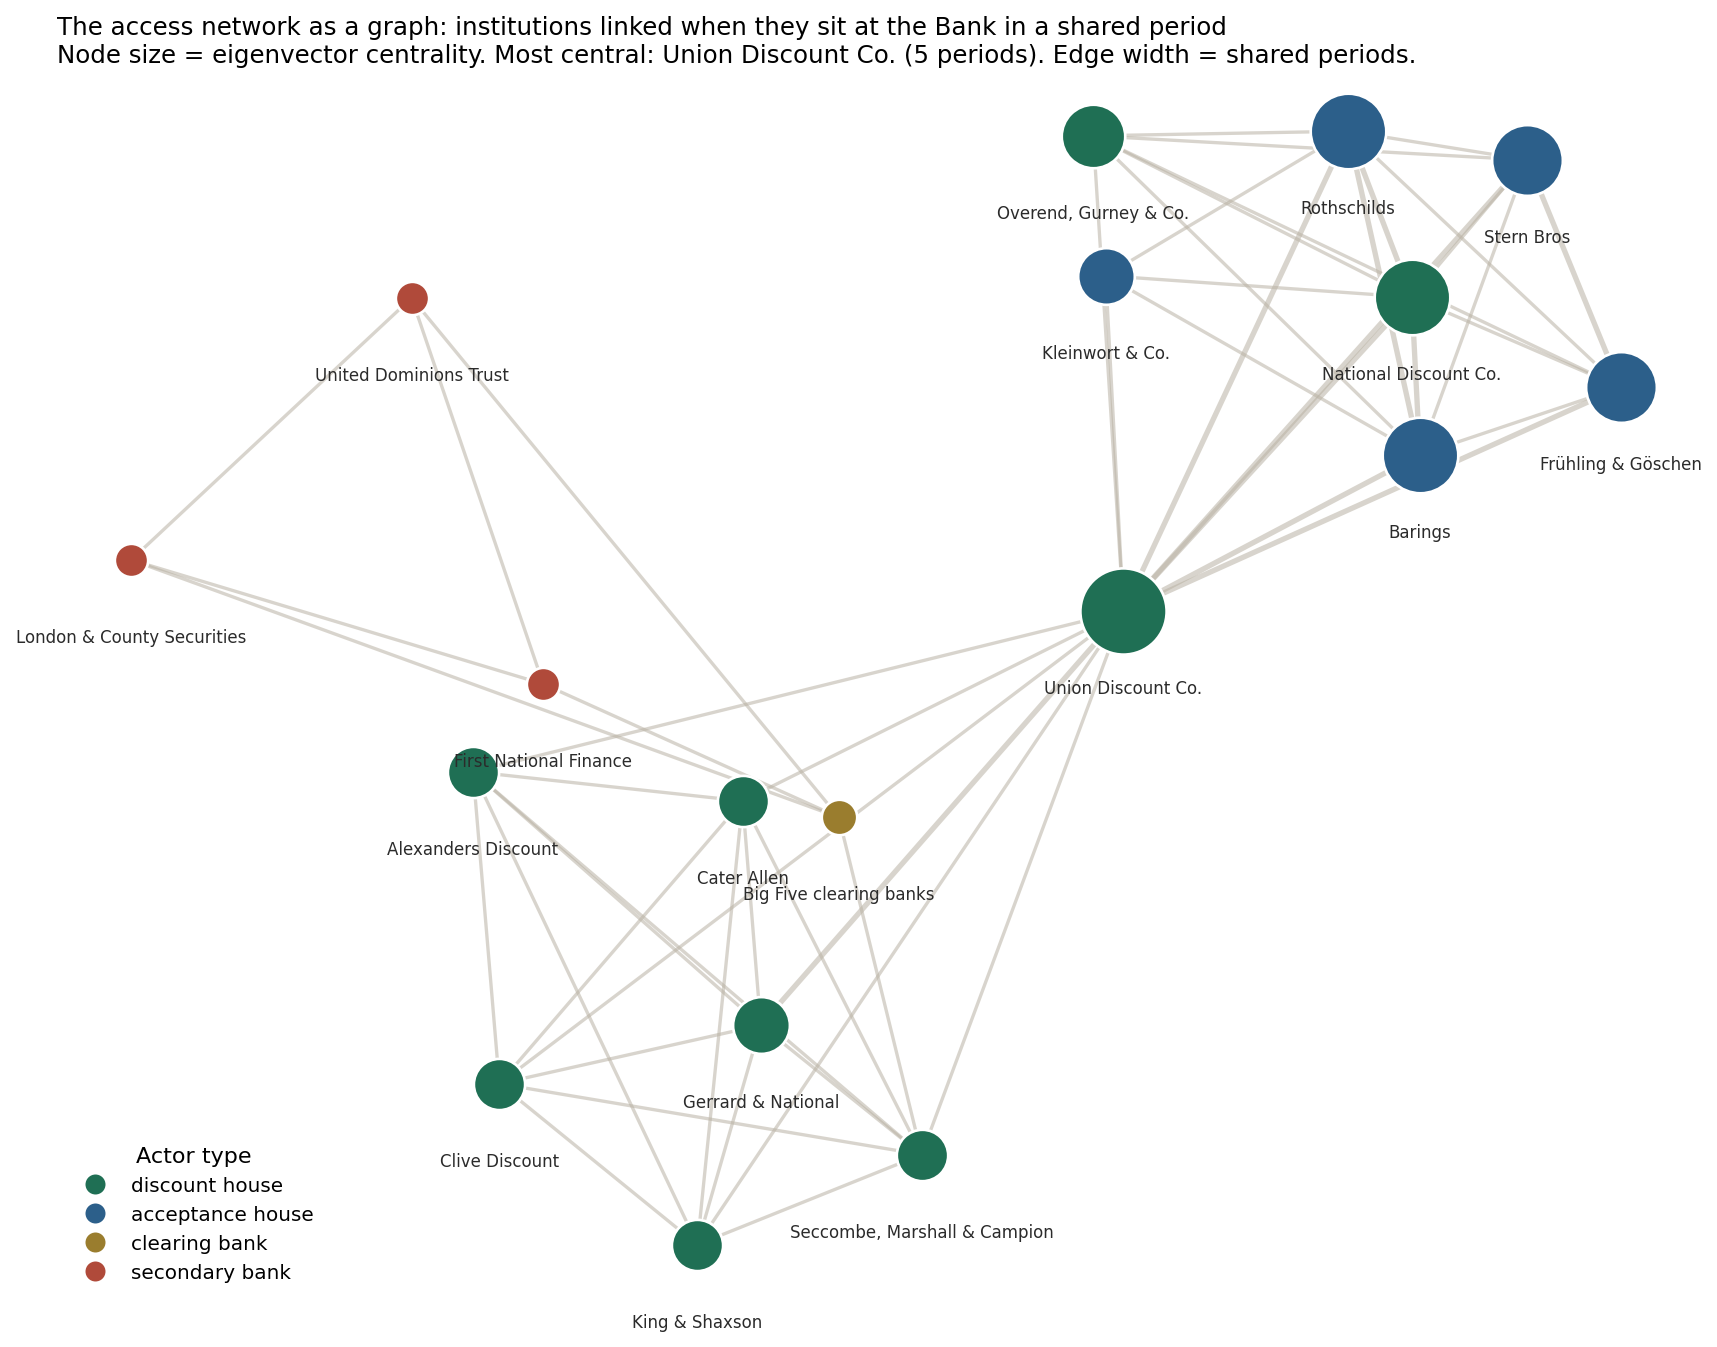
The recurring firms form a network. Each named institution is joined to the crisis periods it appears in, and two firms are linked when they sit at the Bank in the same period. Node size is eigenvector centrality, the standard graph measure of how embedded a node is in the well-connected core. The discount houses, in green, are the spine, and one firm sits at the centre of the whole 150-year structure.

Hover or tap a node · size = eigenvector centrality · edge width = shared periods
Discount house (the core) Acceptance / merchant house Clearing bank Secondary bank (rescued outsider)

A graph-theoretic read of the recurrence evidence. Memberships are the documented named firms from the v6 recurrence tables (Victorian ledgers; Accominotti et al. 2025; Römer 2025; the Bank's discount-market records). Centrality computed with NetworkX in src/v7_flow_network.py; it measures structural position across periods, not transaction volume.

11 — The measurement points

Ten crises, 1847 – 1997

Home-grown External shock Reform
lead277d
1847
Home-grown · commercial
Signal
14 Jan 1847 — Bank Rate climb begins
Rupture
18 Oct 1847
Actors
Bill brokers, discount houses
A long, visible build-up at home.
lead25d
1857
External · United States
Signal
15 Oct 1857 — Bank Rate; window from 6 Sep
Rupture
9 Nov 1857
Actors
Overend Gurney, discount houses
A shorter lead for an imported shock.
lead288d
1866
Home-grown · the Overend panic
Signal
Bank Rate high from 1865; ledger 4 Mar 1866
Rupture
11 May 1866
Actors
Overend, Gurney (fails), discount houses
A long build-up, but a sudden public break.
lead43d
1873
External · weaker evidence
Signal
25 Sep 1873 — Bank Rate
Rupture
7 Nov 1873
Actors
Discount houses
An imported shock with a short lead.
lead142d
1890
Home-grown · the Baring crisis
Signal
26 Jun 1890 — Bank Rate
Rupture
15 Nov 1890
Actors
Barings, the Lidderdale rescue
Home-grown, and a longer lead.
lead68d
1907
External · United States
Signal
15 Aug 1907 — Bank Rate
Rupture
22 Oct 1907
Actors
Post-cable transatlantic pair to 1857
Four decades after the cable, the lead grew.
lead1d
1914
External · the war shock
Signal
30 Jul 1914 — Bank Rate
Rupture
31 Jul 1914
Actors
Acceptance houses, Treasury, joint-stock banks
A war froze the system overnight.
1931
Home-grown · the sterling crisis
Event
Britain leaves the gold standard, Sep 1931
Action
~£25m Treasury bills bought via the discount houses
Actors
Big Five clearing banks, Seccombe Marshall & Campion
Liquidity still flowed through recognised market layers.
1973–75
Home-grown · the lifeboat
Trigger
London & County Securities fails, late 1973
Support
Peaked at £1,285m, March 1975 · ~26 banks
Actors
Bank + clearing banks, on a vetted Control Committee
A selective network rescue, not an open facility.
1997
The institutional break
Date
3 March 1997
Change
The Bank ceases to deal exclusively with the LDMA
Result
A wider defined list of eligible counterparties
Access broadened to a larger closed list, not the public.
Keep scrolling — the timeline moves sideways →
12 — Three clocks

Stress became measurable before it became public.

For each crisis the paper lines up three clocks: the Bank or market signal, the specialist financial record, and the public rupture. A market-facing signal comes first in every case. The lead is longest when trouble grew inside London finance, and it almost vanishes in 1914, when war froze the system overnight.

1847home-grown
277days lead
1857external · US
25days lead
1866home-grown
288days lead
1873external
43days lead
1890home-grown
142days lead
1907external · US
68days lead
1914external · war
1day lead
Earliest market-facing signal Public rupture Home-grown lead External-shock lead
13 — The telegraph test

Did the 1866 cable open the club?

If the City's advantage were only about faster news, the transatlantic cable should have weakened it. Before 1866, market information crossed the Atlantic slowly, by ship. After the cable, a price could travel in minutes.

New York London by ship
1857 · before the cable
0 days
Lead from Bank signal to public rupture
→four decades later
1907 · after the cable
0 days
The same kind of US-origin shock

Prices became faster. Access did not become open. The lead grew rather than shrank, so the telegraph and the club ran through different channels.

14 — The recurring inner circle

The front of the chain was not random.

Union Discount5 periods Overend, Gurney1847·57·66 Seccombe Marshall & Campion1931·96 R. Raphael & Sons Frith Sands Frühling & Göschen→1914 Stern Bros→1914 Alexanders Gerrard & National Cater Allen King & Shaxson
The exact firms changed. The actor type persisted.

Of the ten intermediaries with the highest access scores, all ten reached the Bank's window early. They were mainly discount houses, bill brokers, and merchant banks, exactly the kinds of firms named in the City's own histories. Overend, Gurney recurs until it fails in 1866. Frühling & Göschen and Stern Bros reappear in 1914.

This is not a claim that the same firms controlled everything. Membership turns over. The durable feature is the recognised layer, not any single name.

15 — The benefit test

Early access is not the same thing as profit.

If listed financial firms were being repriced before a public rupture, the Yale Investor's Monthly Manual index should fall. It does not. In 1873, 1890, and 1907 the sector was still rising into the rupture.

The project finds an access advantage, not a proven profit advantage.
+0%
1873 · 6 mo rise
+0%
1890 · 6 mo rise
+0%
1907 · 6 mo rise
90 120 150 1873 1890 1907 Listed financial-sector index, rising into every rupture →

The index is monthly and sector-level, and several key discount houses were never listed. A negative result here means only that no broad listed-sector price footprint is visible. It cannot prove that no individual insider benefited.

16 — Part II · did the structure survive?

The same hub. A changing access layer.

The Bank stays fixed at the centre. The layer between the Bank and the wider public changes shape across 150 years, but it never opens. Each form is a recognised intermediary, not a public market.

↓  Bank of England · fixed at the centre ·  ↓
1830
Bill brokerGiven a discount facility at the Bank.
Victorian
Discount houseBuys and holds bills, funded by call money.
1906 – 1931
Acceptance & clearingGuarantees bills; banks supply the cash.
1973 – 75
The lifeboatBank + clearing banks vet and rescue outsiders.
1996
Authorised counterpartiesSeven recognised houses on a formal list.
1997
The reformA wider defined list. Still not the public.
0
discounters at the Bank in 1906, from 3,554 drawers
£0m
Treasury bills bought via discount houses, 1931
£0m
lifeboat support peak, March 1975 · ~26 banks
0%
of months 1986–96 the Bank still placed deposits

The club did not simply disappear. It became formalized, then widened in 1997.

17 — The continuity index · interactive

Score the structure yourself.

The index scores six yes-or-no criteria per period. The first four separate an open market from a mediated one: an open market would not need named institutions, a formal list, restricted access, or a fixed intermediary route. The last two are about how far we can trust the reading. Toggle a criterion to see what each verdict rests on.

Scoring criteria

Named institutions visibleStructure
Formal eligibility or recognised membershipStructure
Bank access restricted or mediatedStructure
Crisis support routed through intermediariesStructure
Quantitative evidence availableConfidence
Direct crisis evidenceConfidence
Victorian crises1847 – 1914 · conf 0.95
5
The 1906 bill marketbaseline · conf 0.90
4
The 1931 sterling crisisconf 0.80
5
Discount-market structure1830 – 1997 · conf 0.85
4
The 1973–75 lifeboatconf 0.85
6
Authorised counterparties1976 – 1996 · conf 0.90
4
The 1997 reformthe break · conf 0.70
0
Scoring 6 of 6 criteria. The structure scores 4 to 6 from 1847 to 1996, then drops to 0 at the 1997 reform.
18 — The research desk

Why this is digital history.

The pattern only appears when separate digitised sources are placed on one timeline. A contemporary saw one ledger, one newspaper, or one crisis. Click a card to turn it over and read where each source came from, and where it falls short.

SOURCE A

BoE transaction ledgers

Counterparty names, dates, and amounts lent, from the Bank's own archival crisis ledgers.
Turn over →
Origin

Bank archives via Anson et al. 2017.

Why reliable

Working records of the Bank, not later memoirs.

Weakness

Patchy coverage; shows access, never motive.

Used for

Naming the recurring inner circle and its timing.

← Turn back
SOURCE B

Daily Bank Rate

The Bank's daily policy rate from 1833, from A Millennium of Macroeconomic Data.
Turn over →
Origin

BoE Millennium dataset.

Why reliable

Official, continuous, standardised series.

Weakness

A rate rise can have several causes.

Used for

A common daily clock for the lead-time test.

← Turn back
SOURCE C

Newspapers, Hansard & the Bankers' Magazine

Dated public and specialist text that marks when a crisis became speakable.
Turn over →
Origin

British Library HMD, Hansard, Internet Archive.

Why reliable

Contemporary printed records.

Weakness

Survival, scanning, and OCR shape the corpus.

Used for

The public and specialist visibility clocks.

← Turn back
SOURCE D

Yale Investor's Monthly Manual

Monthly listed-financial-sector prices, used as a benefit and profit proxy.
Turn over →
Origin

Yale International Center for Finance.

Why reliable

A contemporary market record, not interpretation.

Weakness

Monthly, sector-level; key houses unlisted.

Used for

Testing whether prices fell before ruptures.

← Turn back
SOURCE E

1906 sterling bills

Counts from 23,493 rediscounted bills, reconstructing the prewar funnel.
Turn over →
Origin

Accominotti, Lucena-Piquero & Ugolini (arXiv).

Why reliable

A large, near-published scholarly reconstruction.

Weakness

1906 is not a crisis year.

Used for

The prewar access funnel.

← Turn back
SOURCE F

Römer's 1931 reconstruction

An archival reconstruction of the Bank's 1931 operations and actor flows.
Turn over →
Origin

Römer 2025, Economic History Review.

Why reliable

Recent peer-reviewed archival study.

Weakness

Raw data not released; the diagram is source-derived.

Used for

The interwar actor-flow network.

← Turn back
SOURCE G

BoE 1967 discount-market history

The Bank's own account of bill brokers, discount houses, and the LDMA.
Turn over →
Origin

BoE Quarterly Bulletin, 1967.

Why reliable

The Bank describing a market it ran.

Weakness

Institutional authorship, not an outside critique.

Used for

The long-run institutional lineage.

← Turn back
SOURCE H

BoE 1978 lifeboat account

The Control Committee, named institutions, support amounts, and entry criteria.
Turn over →
Origin

BoE Quarterly Bulletin, 1978 Q2.

Why reliable

From the organiser of the rescue.

Weakness

A rescuer's account of its own rescue.

Used for

The selective rescue network.

← Turn back
SOURCE I

Discount-house database, 1976–96

Monthly balance sheets, including the sterling deposits the Bank placed with the houses.
Turn over →
Origin

BoE statistical database, series RPMATJD.

Why reliable

Official structured balance-sheet data.

Weakness

Sector aggregate; exposed coverage from 1986.

Used for

Showing the houses still in active use before 1997.

← Turn back
16 — The verdict

The Bank of England's access network did not stay the same. But it also did not simply open.

From Victorian bill brokers to authorised counterparties, crisis access remained mediated through recognised financial actors until 1997.

This is what makes the project digital history: the argument appears only when ledgers, newspapers, rates, prices, and institutional records are linked into one timeline.

TAKEAWAY 01

Crises reveal hidden institutional structures.

TAKEAWAY 02

Faster information did not automatically democratize access.

TAKEAWAY 03

Digital history makes the pattern visible by linking sources never designed to be read together.

THE BRITISH ACCESS NETWORK  ·  Ananya Besufekad  ·  Digital History  ·  June 2026
Built from Bank of England ledgers, the daily Bank Rate, digitised newspapers, the Bankers' Magazine, the 1906 bill reconstruction, Römer 2025, and the Bank's own institutional histories.
Datasets · the evidence base

Nine datasets, one timeline.

The argument depends on linking sources that were never built to be read together. Each card opens to show where the data came from, what it holds, why the project needed it, how it was processed, what it showed, and where it falls short.

1

Bank of England lender-of-last-resort transaction ledgers

Anson, Bholat, Kang & Thomas (2017) · BoE Staff Working Paper 691
▾

Where it came from

The Bank of England, transcribed from its own archival discount ledgers (the C28 series) by a named team and published alongside the 2017 working paper.

What it contains

Loan-by-loan rows for the 1847, 1857, 1866 and 1914 crises: discounter name, amount, rate, collateral, and whether the bill was accepted or rejected.

Why the project needed it

It is the only source that names who actually reached the Bank's discount window during a crisis, which is the heart of the access question.

How it was processed

Reshaped into a long-form table, then names were resolved from 1,476 raw spellings to 1,314 entities and classified by type (discount house, bill broker, merchant bank, clearing bank).

What it showed

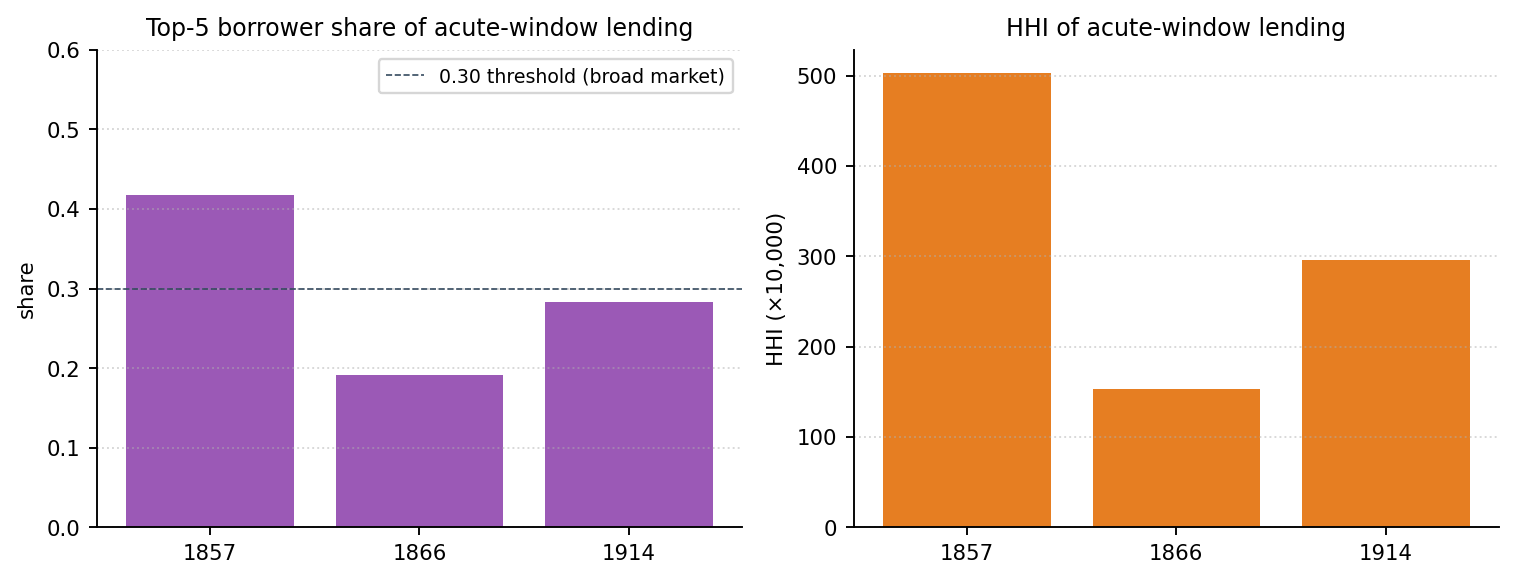
The concentration and breadth of crisis lending: 1866 had the broadest distribution (top-five share 19%, HHI 154), while 1857 was far more concentrated (top-five 42%, HHI 503). It also names the recurring inner circle.

Limitations

No 1890 ledger exists in the release. The 1914 ledger has fewer columns (11 versus 28). 86% of resolved names still carry a manual-review flag, so type shares are lower-bound estimates. The ledger records the what of lending, never the why.

1847 / 57 / 66 / 1914loan-levelprimary, transcribed
2

Daily Bank Rate, from A Millennium of Macroeconomic Data

Bank of England research dataset · sheet D1
▾

Where it came from

The Bank of England's long-run macro compilation, which records the Bank's announced policy rate at daily frequency back to 1833.

What it contains

One row per rate announcement: date and the end-of-day Bank Rate in percent per year.

Why the project needed it

It provides a single, uniform daily clock that every crisis can be measured against, and the rate level needed for the penalty-rate test.

How it was processed

The raw sheet holds 67,578 rows because of intra-day announcements; these were de-duplicated by date to give one settled daily rate.

What it showed

The earliest market-facing signal date for each crisis, and confirmation that the Bank charged a penalty rate in three of the four core crises.

Limitations

It is the Bank's own policy rate, not the market discount rate faced by counterparties, so it cannot speak to the spread individual firms actually paid.

1833–2017dailyofficial series
3

Digitised newspapers, Hansard, and The Bankers' Magazine

British Library HMD · UK Parliament · Internet Archive
▾

Where it came from

Three digitised text corpora: mass-market newspapers, the parliamentary record, and the specialist financial press for professionals.

What it contains

Dated, searchable text in which a crisis is named or discussed, at three levels of audience from insider to public.

Why the project needed it

These supply the public and specialist visibility clocks: the dates on which a crisis became speakable to professionals, then to everyone.

How it was processed

Dated mentions of each crisis were located to fix the public rupture date used in the lead-time comparison.

What it showed

That the specialist record and the public record sit later than the Bank's market-facing signal in every case studied, with the gap widest for home-grown crises.

Limitations

Survival, scanning choices and OCR quality shape which pages exist and are findable, so the corpus is a sample of the historical record, not the whole of it.

19th–20th c.textpublic + specialist
4

Yale Investor's Monthly Manual securities panel

Yale School of Management, cleaned digitised files
▾

Where it came from

A cleaned, digitised version of the Investor's Monthly Manual, a nineteenth- and twentieth-century publication reporting listed securities.

What it contains

One row per listed security per month: company name, industry code, security type, and the late-month quoted price where available.

Why the project needed it

It gives an independent market view of ordinary financial firms, separate from the Bank's own records, to test whether prices moved before a rupture.

How it was processed

Filtered to common and preferred stocks, split into listed financial institutions and non-financial corporates, with monthly returns and the share of declining securities computed.

What it showed

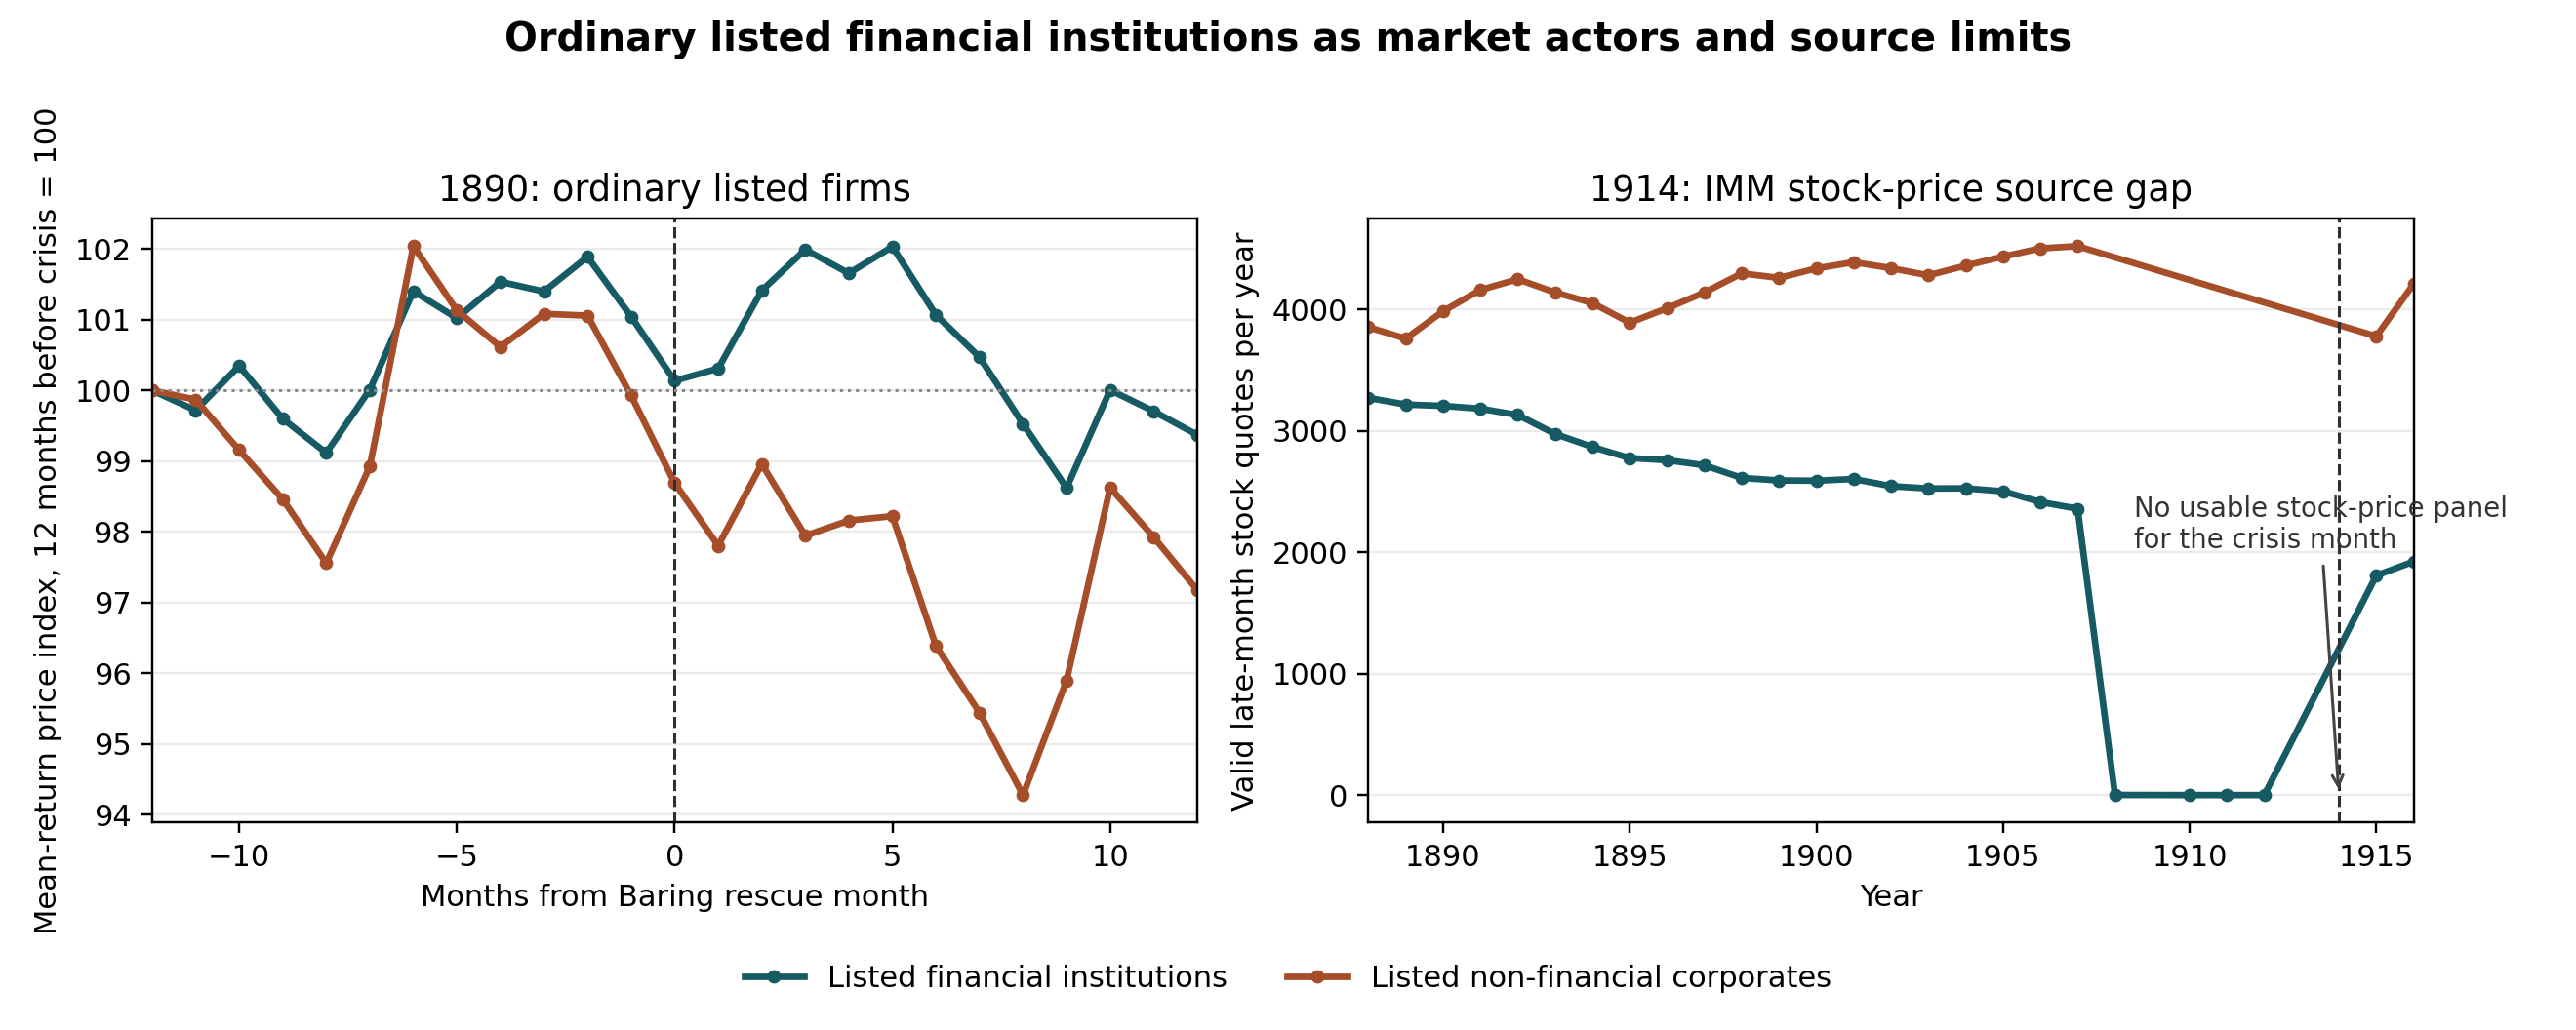
No clear pre-rupture price footprint. In November 1890 listed financial institutions returned about −0.9% against −1.2% for non-financial corporates, a mild and not distinctive move.

Limitations

Monthly and sector-level; quotes are often stale; several key discount houses were never listed; and the panel has a severe quotation gap around 1914.

from 1869monthlymarket prices
5

The 1906 sterling bills reconstruction

Accominotti, Lucena-Piquero & Ugolini
▾

Where it came from

A large scholarly reconstruction of the prewar London bill market built from rediscounted sterling bills.

What it contains

Counts and relationships across tens of thousands of bills, linking the firms that drew, accepted, and rediscounted them.

Why the project needed it

It maps the prewar access funnel: how a very wide base of drawers narrowed to a small set of names that reached the Bank.

How it was processed

Used as a published structure to characterise the funnel from many drawers down to a recognised discounting layer.

What it showed

A steep narrowing: a broad population of drawers passed through acceptance houses to a small recognised group of discounting firms at the apex.

Limitations

1906 is a normal year, not a crisis year, so it describes the standing structure rather than crisis behaviour directly.

1906bill-levelscholarly reconstruction
6

Römer's 1931 reconstruction

Römer (2025), Economic History Review
▾

Where it came from

A recent peer-reviewed archival study of the Bank's operations during the 1931 sterling crisis.

What it contains

An account of how liquidity flowed between the Bank, the clearing banks, and the discount houses during the crisis.

Why the project needed it

It supplies the interwar actor-flow picture at a moment when the project has no transaction ledger of its own.

How it was processed

Read as a source-derived network: actors and flows are taken from the published study rather than re-computed from raw rows.

What it showed

About £25m of Treasury bills bought through the discount houses, with the Big Five clearing banks and named market firms still central. The recognised market layer carried crisis liquidity.

Limitations

The underlying raw data are not released, so the diagram is derived from the study's account rather than independently reconstructed.

1931actor flowspeer-reviewed
7

Bank of England 1967 discount-market history

BoE Quarterly Bulletin, 1967
▾

Where it came from

The Bank's own published account of the London discount market and its institutions.

What it contains

An institutional narrative of bill brokers, discount houses, and the London Discount Market Association.

Why the project needed it

It establishes the long-run institutional lineage that connects the Victorian bill broker to the later authorised counterparty.

How it was processed

Read as a primary institutional source for the continuity of roles across the twentieth century.

What it showed

That the discount market was a recognised, named, and self-organising layer between the Bank and the wider market, with continuity of function over decades.

Limitations

It is the Bank describing a market it operated, so it is an institutional account rather than an independent critique.

1967institutional historyprimary
8

Bank of England 1978 secondary banking crisis account

BoE Quarterly Bulletin, 1978 Q2
▾

Where it came from

The Bank's published account of the 1973–75 secondary banking crisis, known as the lifeboat.

What it contains

The structure of the rescue: the Control Committee, the named participating institutions, the support amounts, and the entry criteria.

Why the project needed it

It documents a selective rescue network in the modern era, the late equivalent of the Victorian inner circle.

How it was processed

Read for the membership and governance of the rescue, and the scale of support over time.

What it showed

Support peaked at about £1,285m across roughly 26 banks, organised by the Bank with the clearing banks on a vetted committee. A closed, mediated rescue, not an open facility.

Limitations

It is the organiser's own account of its own rescue, so the framing reflects the Bank's perspective.

1973–75rescue networkprimary
9

Bank of England discount-house database, 1976–1996

BoE statistical database
▾

Where it came from

The Bank's structured statistical record of the discount houses' monthly balance sheets.

What it contains

Monthly balance-sheet items for the discount houses, including the sterling deposits the Bank itself placed with them.

Why the project needed it

It shows whether the recognised market layer was still in active use right up to the 1997 reform.

How it was processed

Read as a monthly series to track the Bank's continued placement of deposits with the houses across 1986–96.

What it showed

The Bank still placed deposits with the discount houses in roughly 85% of months across 1986–96. The structure was not a relic; it was operating until the reform.

Limitations

It is a sector aggregate, and the most exposed coverage runs only from 1986, so firm-level detail before then is limited.

1976–1996monthly balance sheetofficial series

Also drawn on in support: the JST Macrohistory panel (annual UK macro context from 1870, used for 1890 and 1914) and the Bank of England Daily Account Books C1/38 (1890 page images, transcribed for October to December via a vision model and validated against weekly anchors). Both are documented in full on the Sources tab.

Sources · the research desk

Reading the archive critically.

Every dataset is a derivative of some original record, made by particular people for particular reasons. This desk lays out where each source came from, who made it, how it was digitised, why it can be trusted, and the specific claims it cannot support. The previews below are archive-style representations, not reproductions of the originals.

CounterpartyCollateral£ valueAcc.
•••• & Cobank billY
•••• Bank LtdcommercialY
•••• Discountbank billY
•••• & Sonsgovt sec.N
•••• BroscommercialY
BoE discount ledgerarchive-style
THE CITY ARTICLE
Newspapers & Hansardarchive-style
Daily Bank Raterepresentation
SecurityIndustryPrice
•••• BankFinancial
•••• AssceFinancial
•••• RailCorporate
•••• FinanceFinancial
•••• CoCorporate
Investor's Monthly Manualarchive-style
Bank of England
Quarterly Bulletin
Discount market · lifeboat accounts · 1967 & 1978
BoE Quarterly Bulletinrepresentation
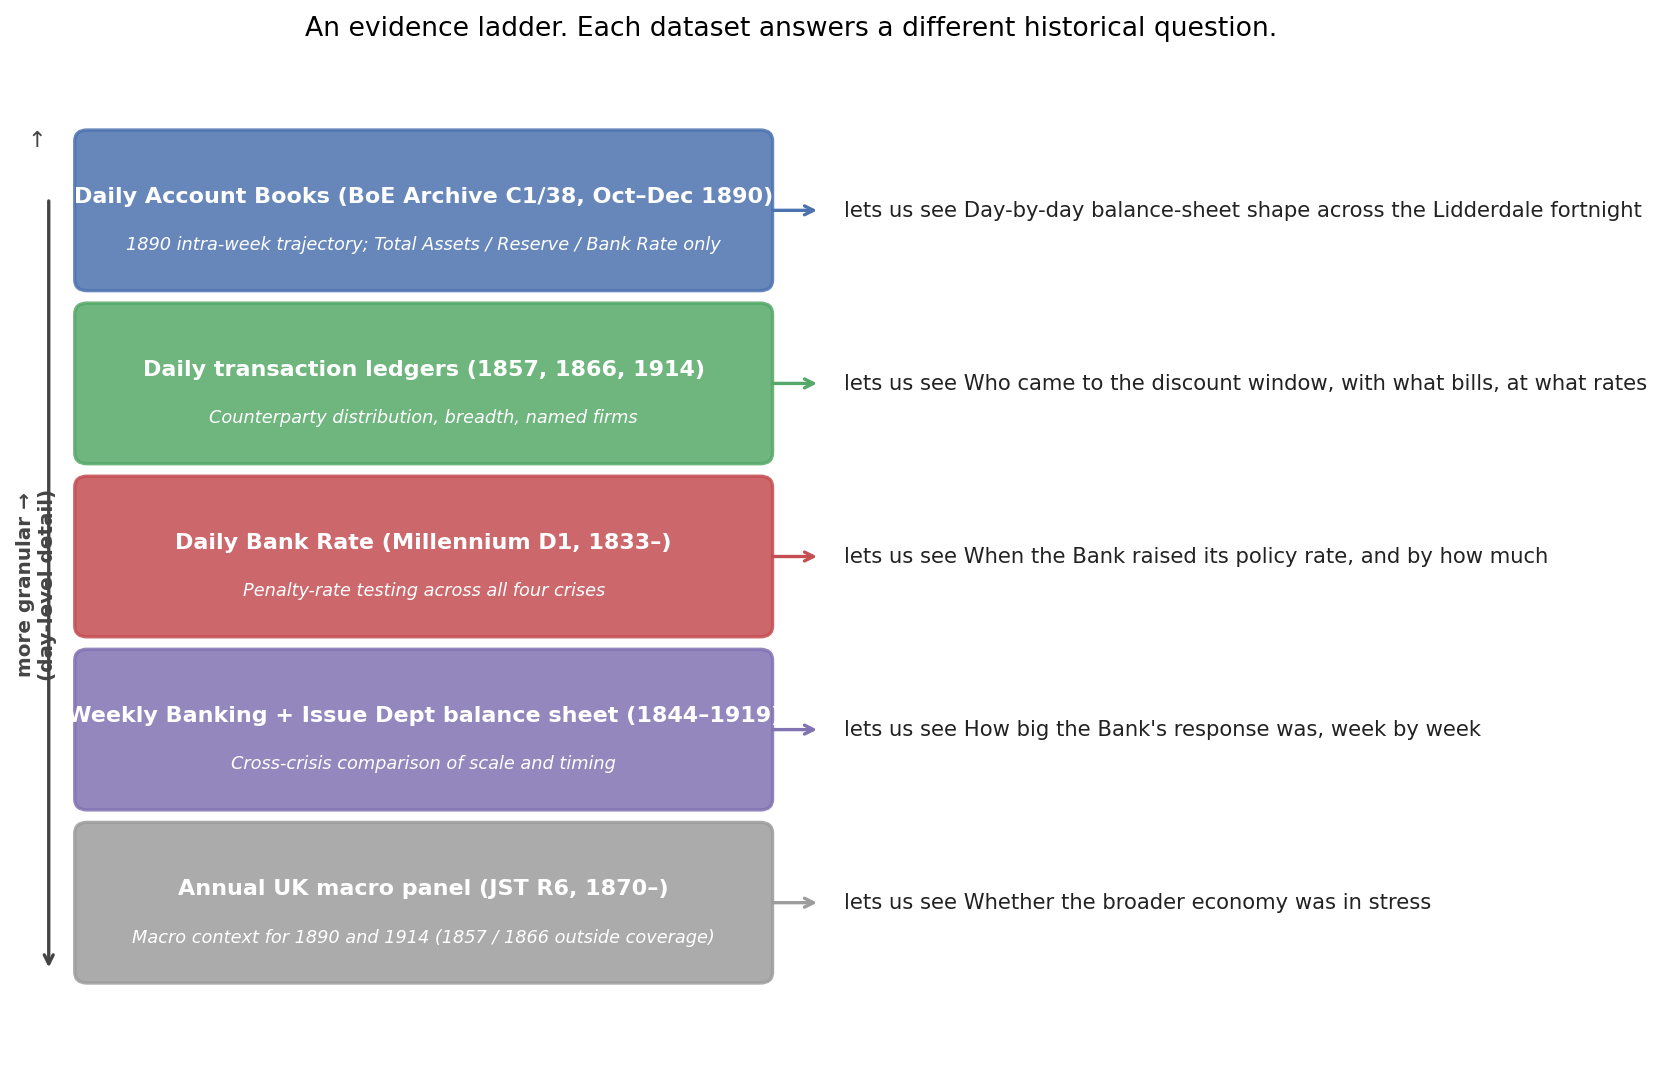
The evidence ladder: rungs from weekly balance sheets to daily ledgers to text

BoE transaction ledgers

Rung 3 · loan-level
A digitised transcription of the Bank's own archival discount ledgers.

Obtained from

Published by the Bank of England with Anson, Bholat, Kang & Thomas (2017).

Created by

Bank clerks who recorded each discount; transcribed by a named team from the archival C28 series.

Curated / digitised

Hand-transcribed from page images into a spreadsheet, with raw transactions and pre-computed metrics.

Why reliable

Working records of the Bank itself, with an independent secondary cross-check on the 1866 portion.

Biases / weaknesses

Clerks' name spellings vary; no 1890 ledger; the 1914 ledger is thinner; classification still mostly flagged for review.

Cannot claim

It cannot show motive or decision rationale, a counterparty's wider balance sheet, or any credit that did not pass through the Bank's window.

Daily Bank Rate

Rung 2 · daily policy rate
The Bank's own announced rate, digitised to daily frequency.

Obtained from

A Millennium of Macroeconomic Data, the Bank's long-run compilation.

Created by

The Bank of England, drawing the rate from its internal and published records.

Curated / digitised

Daily observations digitised into a single sheet, then de-duplicated by date for this project.

Why reliable

The authoritative record of the Bank's own rate, used to cross-check the 1890 image transcription.

Biases / weaknesses

It is a policy rate, not a market rate, and intra-day changes had to be settled to one daily value.

Cannot claim

It cannot describe the open-market discount rates that counterparties actually faced.

Newspapers, Hansard & the Bankers' Magazine

Rung 1 · dated text
Three digitised corpora at three levels of audience.

Obtained from

British Library digitised newspapers, the Hansard parliamentary record, and Internet Archive runs of the specialist press.

Created by

Contemporary editors, reporters, and parliamentary recorders.

Curated / digitised

Scanned and OCR'd by their respective libraries and archives.

Why reliable

Contemporary printed records, dated at the point of publication.

Biases / weaknesses

Survival, scanning selection, and OCR quality all shape which pages are present and findable.

Cannot claim

Absence of a mention is not proof of absence; the corpus is a sample, not the complete record.

Yale Investor's Monthly Manual

Beside the ladder · market prices
A cleaned digitised derivative of a printed price source.

Obtained from

Cleaned files published by the Yale School of Management.

Created by

The original publication recorded listed securities; Yale produced the cleaned digital panel.

Curated / digitised

Filtered to common and preferred stocks and split into financial and non-financial sectors.

Why reliable

A contemporary market record independent of the Bank, with hundreds of quoted securities around 1890.

Biases / weaknesses

Monthly and often stale; key discount houses unlisted; a severe quote gap around 1914.

Cannot claim

It cannot show whether any individual firm benefited, nor support a 1914 ordinary-bank comparison.

BoE Quarterly Bulletin histories

Institutional record · 1967 & 1978
The Bank's own narratives of the discount market and the lifeboat.

Obtained from

The Bank of England Quarterly Bulletin, 1967 and 1978 Q2.

Created by

The Bank of England's own staff.

Curated / digitised

Published institutional accounts, read here as primary sources on structure and membership.

Why reliable

Written by the institution that ran the market and organised the rescue, with named participants and amounts.

Biases / weaknesses

Institutional authorship: the Bank narrating its own market and its own rescue.

Cannot claim

They are not independent critiques and should be read alongside outside scholarship.

BoE Daily Account Books C1/38

Primary image · 1890
Photographs of the Bank's daily balance-sheet ledger, transcribed by a vision model.

Obtained from

The Bank of England Archive, via its digital image service.

Created by

Bank clerks recording the daily Banking and Issue Department balances in 1890.

Curated / digitised

Eighteen page images for October to December 1890, transcribed by a vision model after OCR proved too weak.

Why reliable

The Bank's own daily record; the transcription validates against weekly anchors at 92 to 100% for the variables kept.

Biases / weaknesses

Only three months are transcribed, and only a few balance-sheet variables passed validation.

Cannot claim

It carries no counterparty identities and supports no cross-crisis daily comparison.

Source absence is not historical absence. A gap in the data this project uses, such as the missing 1890 transaction ledger, is a limit of the project's coverage, not proof that the underlying record never existed. Where a claim cannot be traced through this chain, the project does not make it.

Methods · how the analysis works

Ten methods, in plain terms.

No finance background needed. Each method below names the question it answers, the data it uses, how it works in simple language, what it produces, and where it can mislead.

Method 01

Transaction-ledger analysis

Who actually borrowed from the Bank during a crisis?

Data
BoE transaction ledgers (1847 / 57 / 66 / 1914).
How
Read every loan as a row, then total and rank borrowing by firm within each crisis window.
Output
A ranked list of the firms closest to the Bank's window in each crisis.
Limit
Only four crises have ledgers, and 1914's is thinner.
Method 02

Counterparty classification

What kind of institution was each borrower?

Data
The cleaned ledger names.
How
Match messy spellings to one canonical name, then label each as a discount house, bill broker, merchant bank, clearing bank, or other.
Output
A type for each firm, so borrowing can be grouped by actor type.
Limit
Most labels are flagged for review, so type shares are lower bounds.
Method 03

Recurrence analysis

Do the same firms or firm types keep reappearing?

Data
The classified ledgers across crises.
How
Count how many crises each firm and each firm type appears in near the front of the chain.
Output
A recurrence score showing which actors persist over time.
Limit
Firm names turn over, so the durable unit is the type, not the name.
Method 04

Lead-time analysis

How early was stress visible to the market versus the public?

Data
Daily Bank Rate plus dated newspaper and Hansard mentions.
How
For each crisis, find the earliest market-facing signal date and the public rupture date, then measure the gap in days.
Output
A lead time per crisis, from 1 day to 288 days.
Limit
It measures dated visibility, not what anyone knew or did.
Method 05

Text mining for visibility clocks

When did each crisis become speakable, and to whom?

Data
Digitised newspapers, Hansard, and the specialist press.
How
Search dated text for when each crisis is first named, at insider and public levels.
Output
Two visibility clocks, specialist and public, to compare against the market signal.
Limit
Scanning and OCR gaps can move a first-mention date.
Method 06

Concentration and funnel analysis

How narrow was access to the Bank?

Data
Ledger totals by firm, plus the 1906 bills reconstruction.
How
Measure how much borrowing the top few firms account for, using top-five share and a concentration index.
Output
Concentration figures per crisis and a picture of the prewar funnel.
Limit
Concentration describes structure, not intent.
Method 07

Source-derived actor-flow networks

How did liquidity move between institutions?

Data
Ledgers for 1857 / 66 / 1914; published studies for 1931 and 1973–75.
How
Draw actors as nodes and flows as links, from raw rows where available and from the literature where not.
Output
Network diagrams showing the Bank, its intermediaries, and the wider market.
Limit
The 1931 and 1973–75 networks are derived from studies, not raw data.
Method 08

Time-series summary

How did the Bank's balance sheet move through a crisis?

Data
Weekly balance sheet and daily Bank Rate.
How
Line up each crisis on a shared clock and compare lending, reserves, and rate around the trigger.
Output
Event-time charts that make crises comparable side by side.
Limit
Weekly data cannot resolve within-week timing.
Method 09

Continuity-index scoring

Was the access structure open or mediated, and how sure can we be?

Data
All of the above, per period.
How
Score six yes-or-no criteria for each period: four about structure, two about how much we can trust the reading.
Output
A comparable score per period, high from 1847 to 1996, then dropping at 1997.
Limit
The criteria are a deliberate simplification of a richer record.
Method 10

Price-proxy test

Did markets reprice financial firms before a public rupture?

Data
Yale Investor's Monthly Manual prices.
How
Track listed financial-sector prices into each rupture and compare against non-financial firms.
Output
A test of whether an access advantage left a visible price footprint.
Limit
Monthly, sector-level, and blind to unlisted firms, so a null result is not proof of no benefit.
Results · the calculated outputs

What the numbers actually show.

The findings, each with what was measured, what it shows, why it matters to the argument, and one line on its limitation. Charts are the project's own outputs; the diagrams for 1931 and 1973–75 are source-derived.

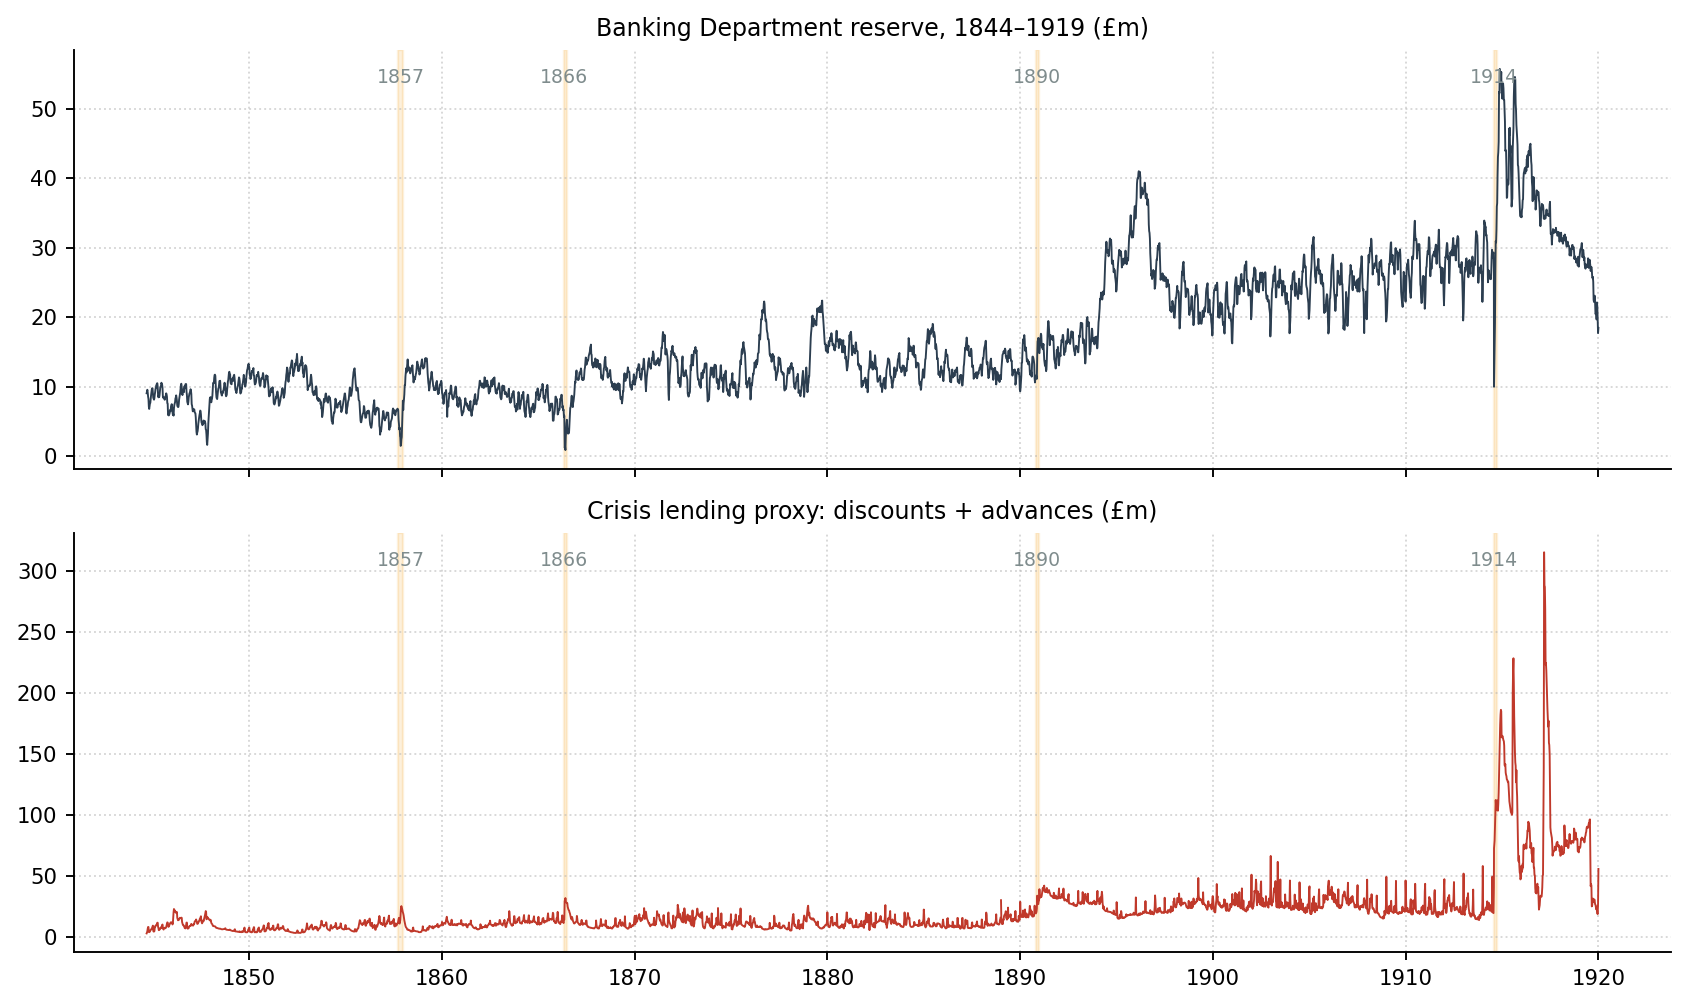
The crisis arc, 1847 to 1997
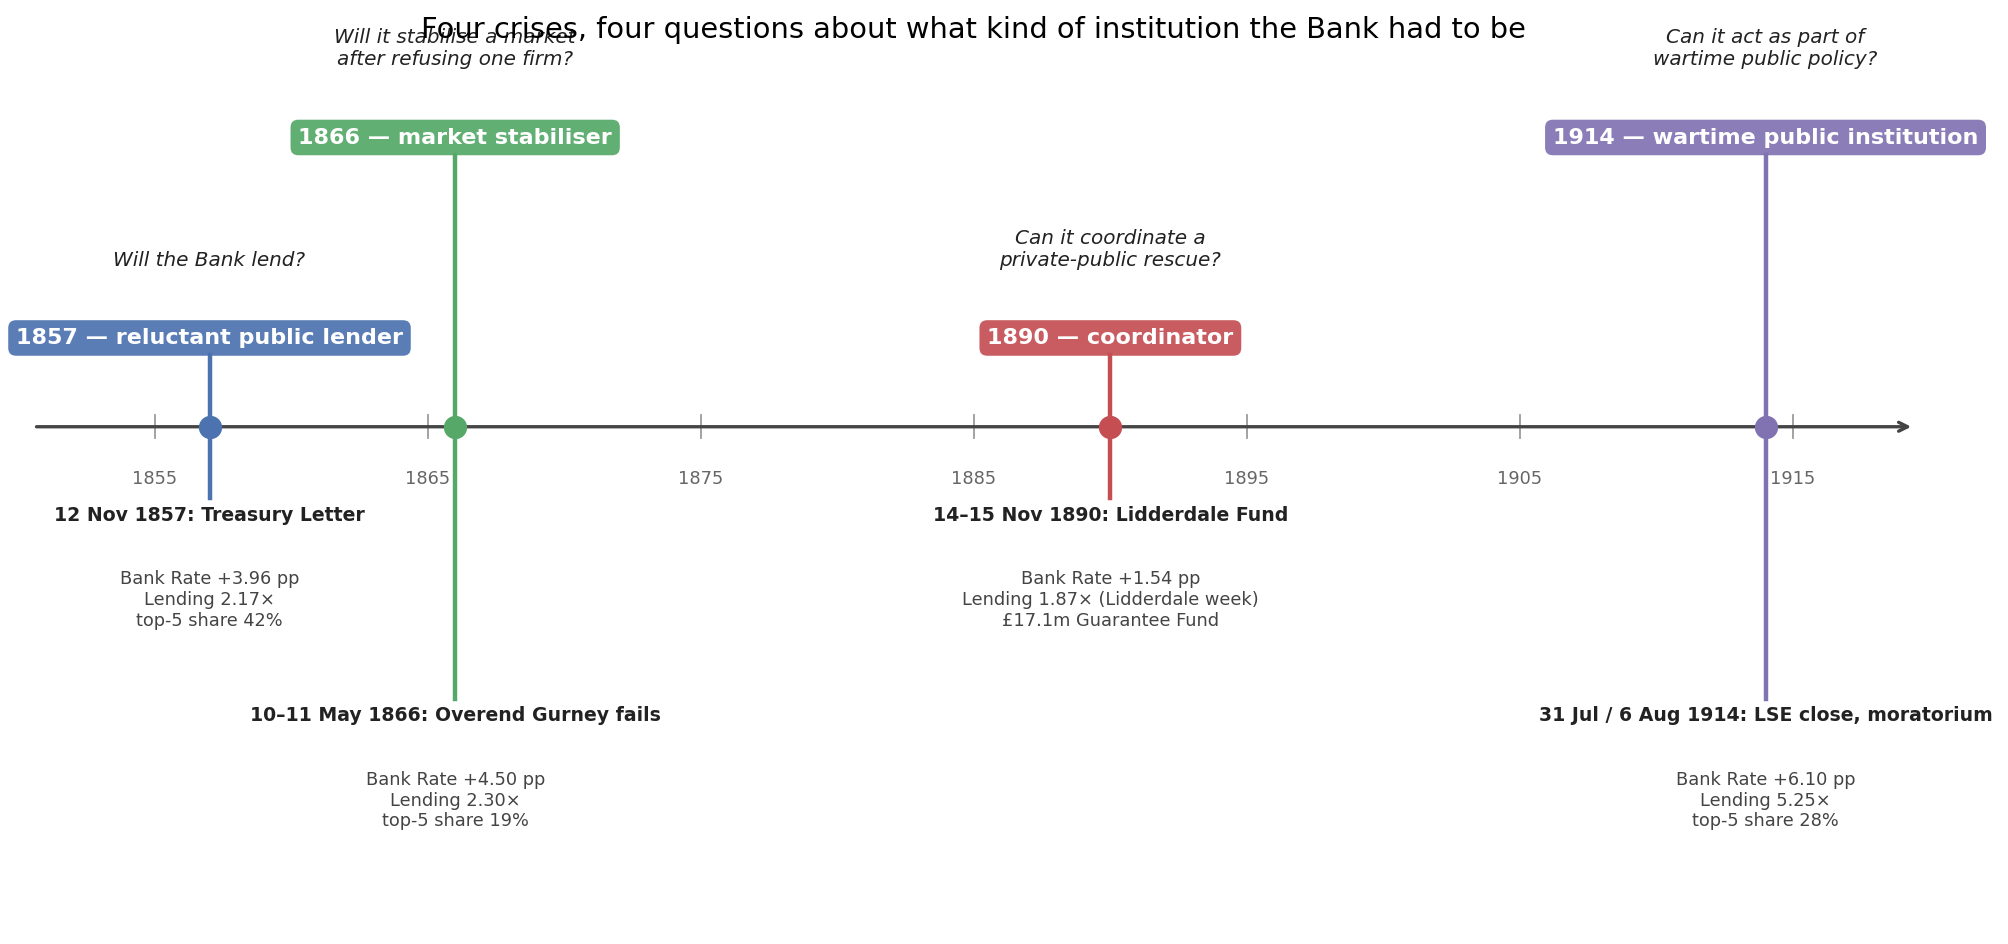
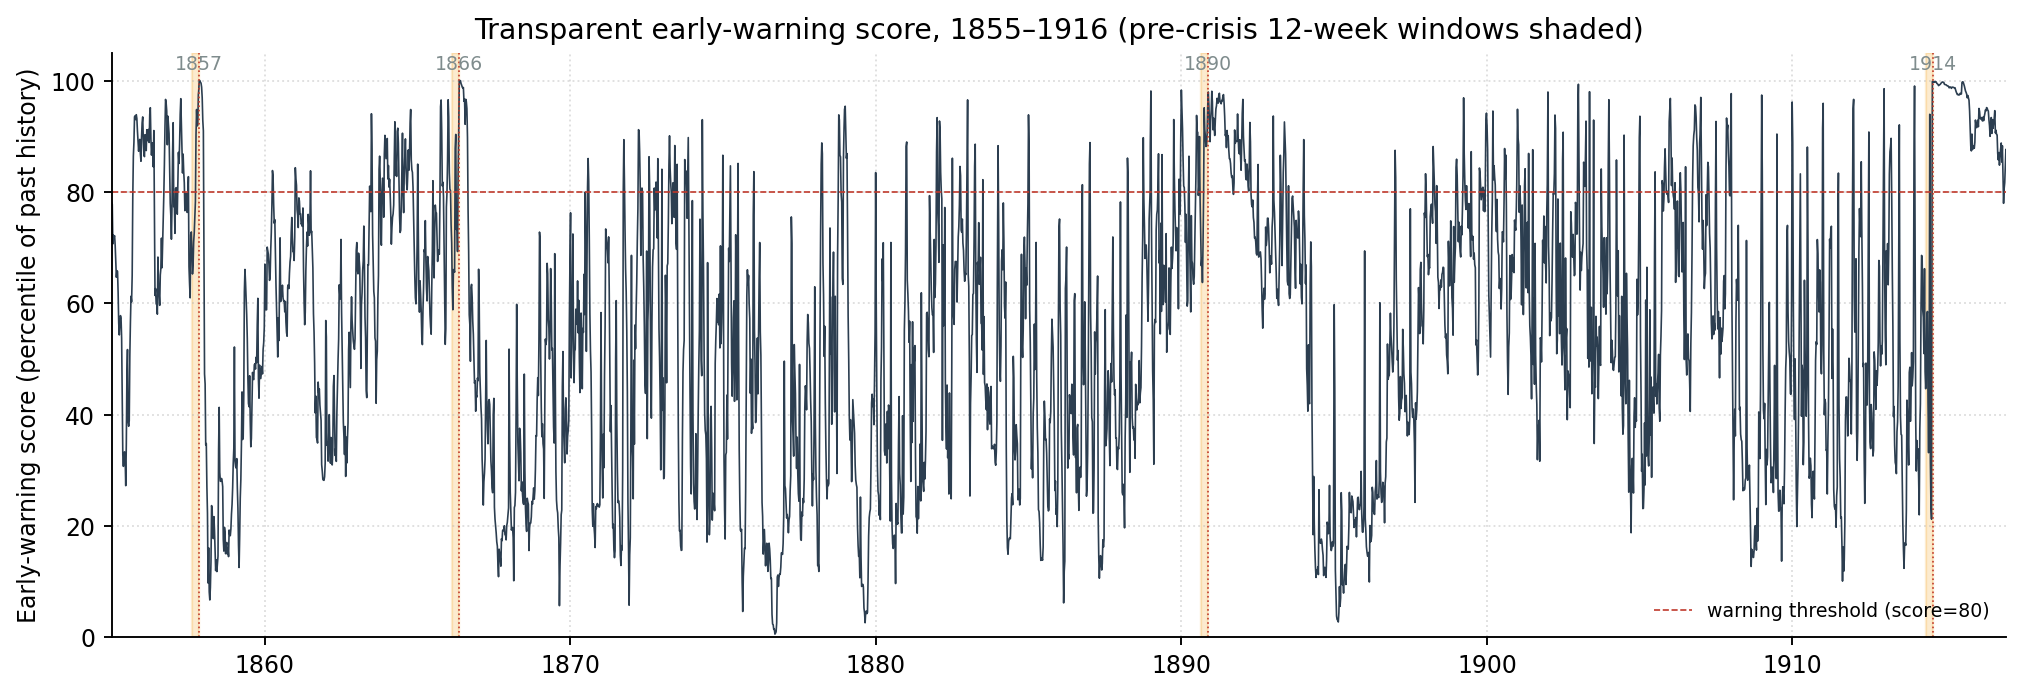
Early-warning timeline across crises
Result 01 · lead time

Insider-to-public lead by crisis

288 d
longest lead · 1866
1 d
shortest lead · 1914

What it shows

A market-facing signal appears before the public rupture in every crisis studied. The lead is longest for home-grown crises and almost vanishes when war froze the system in 1914.

Why it matters

Stress was measurable inside London finance well before it became public, which is what an access advantage looks like.

Limit · the dates measure visibility and positioning, not what anyone knew or did.
1857 · before cable 25 days 1907 · after cable 68 days Lead GREW after faster prices →
Result 02 · the telegraph test

Faster prices did not open access

What it shows

Comparing two US-origin shocks, the insider-to-public lead grew from 25 days in 1857 to 68 days in 1907, after the 1866 transatlantic cable made prices travel in minutes.

Why it matters

If the advantage were only about fast news, the lead should have shrunk. It widened, so price speed and access ran on different channels.

Limit · two crises is a small comparison, and each had its own causes.
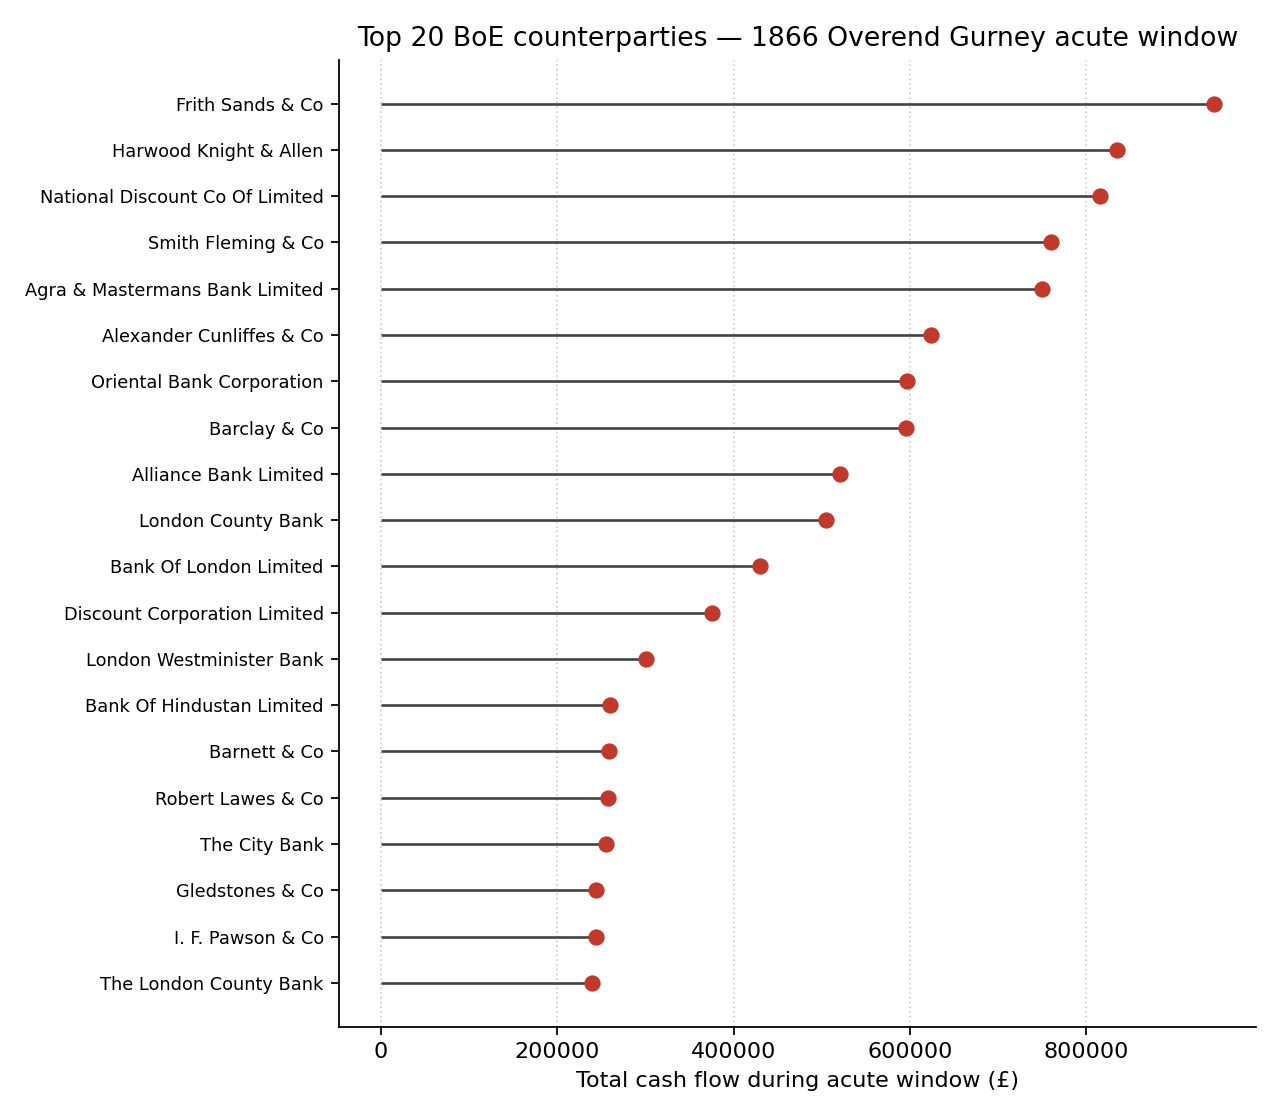
Top 20 BoE counterparties, 1866 acute window
Result 03 · recurring inner circle

The same actor types, again and again

What it shows

The firms closest to the Bank are mainly discount houses, bill brokers, and merchant banks. Names like Overend Gurney, Frith Sands, and National Discount sit at the top of the 1866 window.

Why it matters

The exact firms change across crises, but the recognised actor type at the front of the chain persists.

Limit · membership turns over, so this is continuity of type, not of any single firm.
The access network as a graph, with Union Discount Co. at the centre
Result 03b · the access network as a graph

One firm sits at the centre of 150 years

What it shows

Turning the recurrence evidence into a graph and measuring it, Union Discount Co. has the highest eigenvector centrality (0.49) and the highest betweenness. It is the single node bridging the Victorian acceptance cluster to the 1996 authorised list, and half of the eighteen named firms are discount houses.

Why it matters

The word "network" in the title is now a measured object, not a metaphor. The connected spine of the graph is the discount houses; the rescued secondary banks of the 1970s sit on its outer edge.

Limit · built from documented named firms, so it describes the structure the sources record, not a hidden one. Try the interactive version in the Story tab.
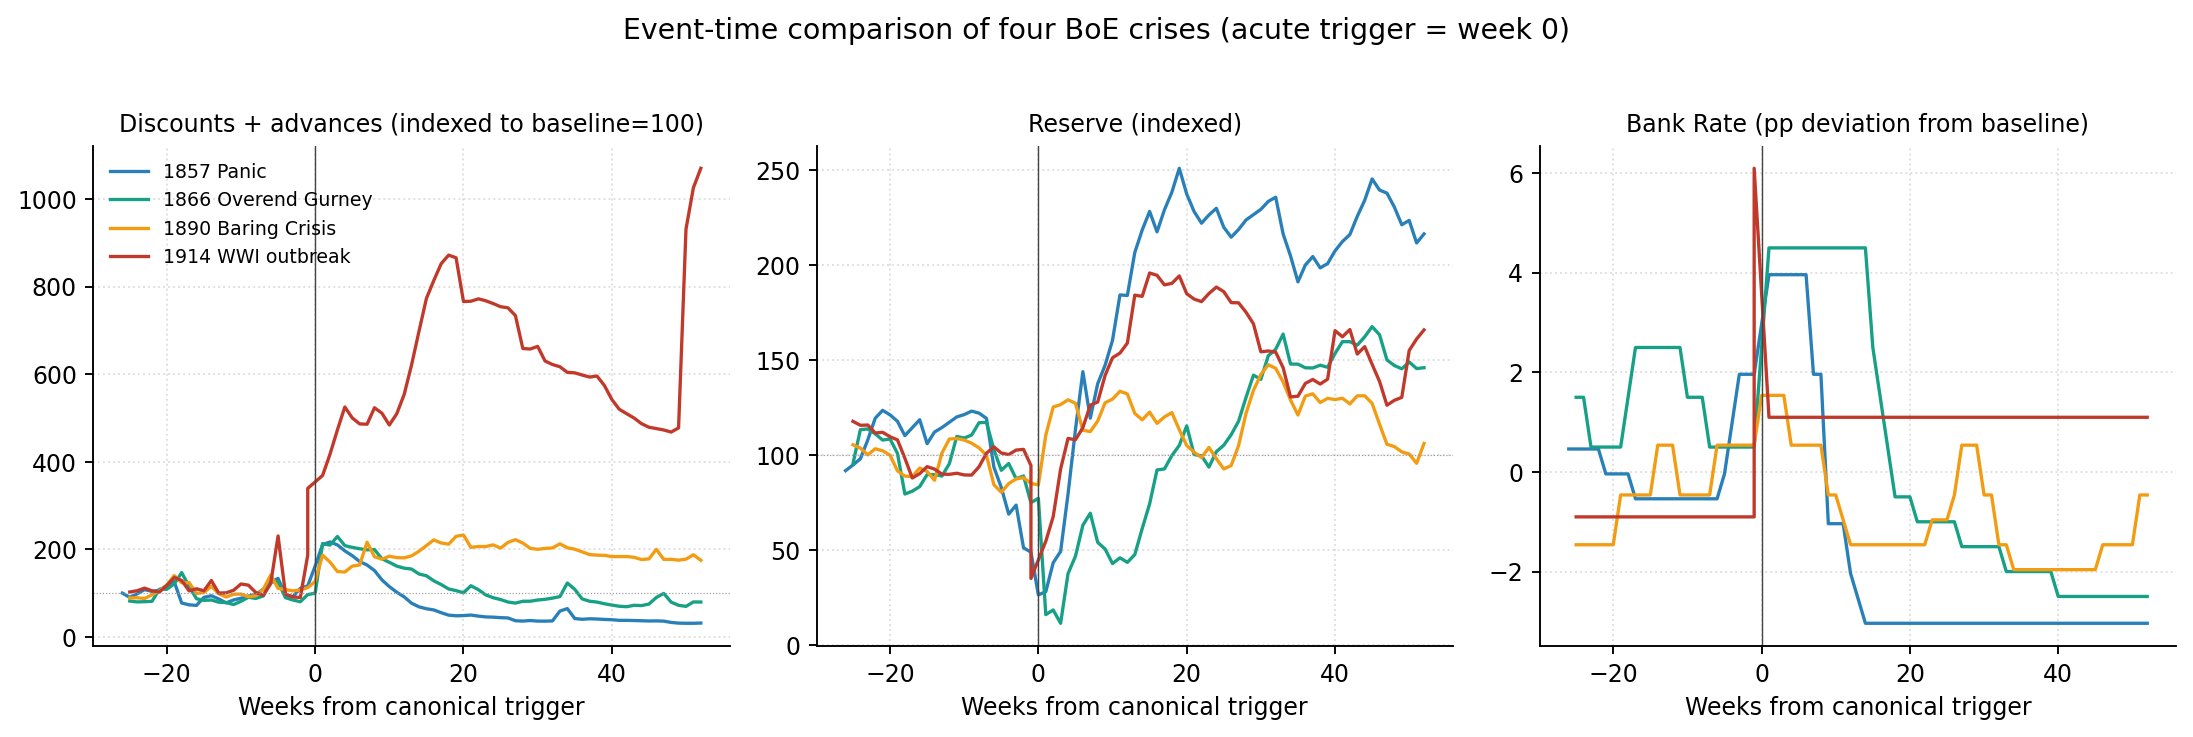
Event-time comparison of four crises
Result 04 · time-series summary

Four crises on one clock

What it shows

Lined up at their trigger week, the crises share a shape: lending surges, reserves dip then rebuild, and Bank Rate spikes. 1914 dwarfs the others in scale.

Why it matters

A shared event-time frame makes very different crises directly comparable and shows the Bank's response was systematic.

Limit · weekly data cannot resolve day-by-day timing within a week.
Listed financial vs non-financial market comparison
Result 05 · the benefit test

Access, but no visible price footprint

−0.9%
listed financials · Nov 1890
−1.2%
non-financials · Nov 1890

What it shows

Listed financial firms did not visibly fall before ruptures. Around the 1890 crisis their move was mild and no more negative than the wider market.

Why it matters

The project finds an access advantage, not a proven profit advantage. The two are not the same.

Limit · monthly, sector-level, and blind to unlisted houses, so it cannot rule out individual benefit.
Concentration comparison across crises
Result 06 · the access funnel

A wide base narrowing to a few names

42%
top-5 share · 1857
19%
top-5 share · 1866

What it shows

Crisis borrowing concentrates in a small group. 1857 was highly concentrated (top-five 42%, index 503), 1866 the broadest (top-five 19%, index 154). The prewar bill market funnelled many drawers down to a recognised discounting layer.

Why it matters

Access narrowed structurally toward the Bank, even when many firms drew bills lower down the chain.

Limit · concentration describes structure, not intent.
Bank Discounthouses Big Fivebanks ~£25m Treasury bills · Seccombe Marshall & Campion
Result 07 · 1931 actor flow

Crisis liquidity ran through the market layer

What it shows

In the 1931 sterling crisis the Bank bought about £25m of Treasury bills through the discount houses, with the Big Five clearing banks and named market firms central.

Why it matters

Even without a transaction ledger, the interwar Bank still worked through recognised intermediaries.

Limit · derived from a published study, not from raw transaction rows.
Bank Clearingbanks Control Committee ~26 vetted banks peak support £1,285m · Mar 1975
Result 08 · the lifeboat

A selective rescue, not an open door

£1,285m
peak support · Mar 1975
~26
vetted banks

What it shows

The 1973–75 rescue was organised by the Bank with the clearing banks on a vetted Control Committee, with entry criteria and named members.

Why it matters

The modern equivalent of the Victorian inner circle was still a closed, mediated network.

Limit · the account comes from the rescue's own organiser.
Long-run balance sheet of the discount houses
Result 09 · still in use, 1986–96

The structure was operating to the end

~85%
of months the Bank still placed deposits

What it shows

Across 1986–96 the Bank still placed sterling deposits with the discount houses in roughly 85% of months, right up to the 1997 reform.

Why it matters

The recognised market layer was not a relic by the 1990s; it was a working part of how the Bank operated.

Limit · a sector aggregate, with the most exposed coverage only from 1986.
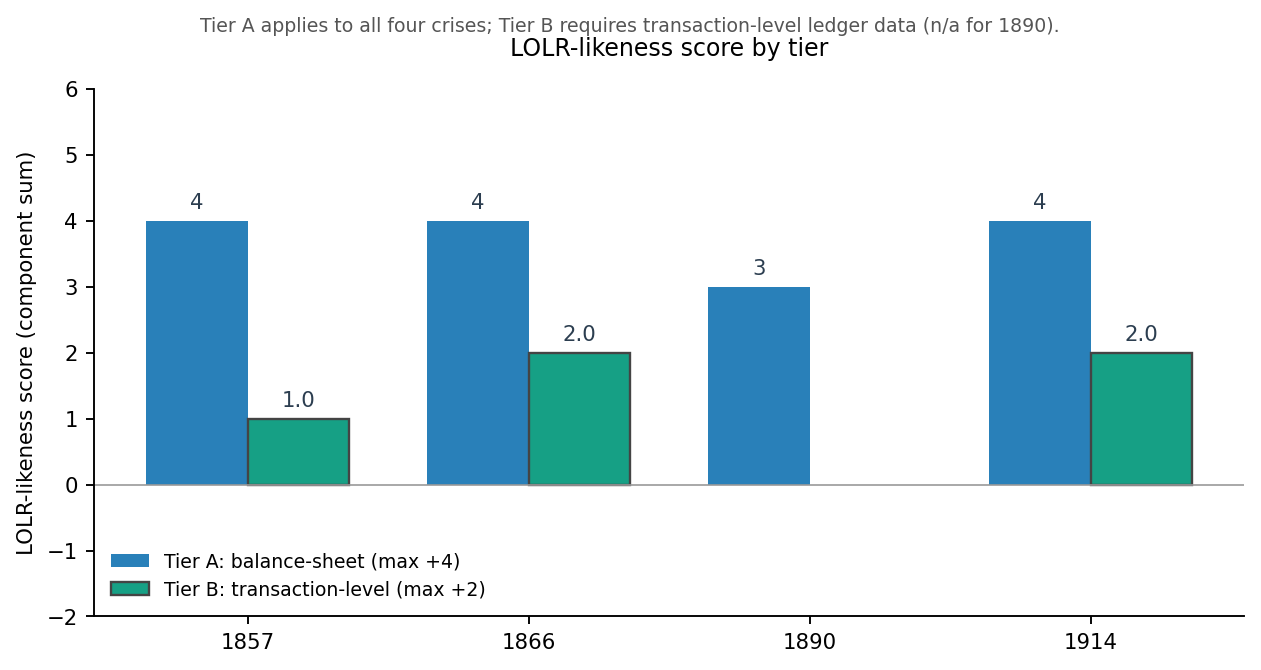
Lender-of-last-resort criteria score by crisis
Result 10 · continuity index

Mediated from 1847 to 1996, then widened

5–6
criteria met · 1847–1996
0
at the 1997 reform

What it shows

Scored against the lender-of-last-resort criteria, the crises cluster high (1857 and 1914 score 5 of 6, 1866 scores 6), confirming a consistent, mediated structure.

Why it matters

The structure stayed recognisably the same for 150 years, then changed form at 1997 rather than simply opening.

Limit · the criteria are a deliberate simplification, and 1890 lacks a ledger to score fully.
FirmPeriods
Union Discount5
Overend, Gurney & Co.3
Seccombe Marshall & Campion2
Frith Sands & Co.2
R. Raphael & Sons2
Result 11 · named recurrence score

A handful of names span the crises

What it shows

A small set of recognised firms appears across multiple crises, with Union Discount in five periods and Overend Gurney recurring until it fails in 1866.

Why it matters

It puts named evidence behind the claim that the inner circle was durable, not random.

Limit · counts depend on name resolution, which is conservative by design.
← / → to navigate
Digital History · Presentation
The British Access Network
How the Bank of England handled financial crises from 1847 to 1997: through an open public market, or a closed circle of recognised City firms?
Bank / market signal · earlier Public headline · later the rupture
The research question

An open market, or an access network?

Across Britain's crises from 1847 to 1996, did the Bank of England manage stress through an open public market, or through a narrow recognised access network?
If markets became modern and efficient, access should have opened. The evidence suggests a different story: prices became faster, while access stayed mediated.
Q1 Did a Victorian inner circle sit at the front of the chain?
Q2 Did the 1866 telegraph weaken that advantage?
Q3 Did the structure survive into the twentieth century?
The scholarly debate

The project tests whether faster information also meant open access.

Closed access club
HopkinsAmini & TomsGorton & OrdoñezFlandreau & Ugolini

Finance shaped by elite networks, private information, and privileged access.

vs
Efficient, faster market
HoagRichmond FedRothschild ArchiveSchneider

Information became faster, prices more efficient, and insider-profit stories can be myths.

Prices became faster. This project asks whether access stayed mediated.
The datasets · the evidence base

Nine sources, each answering one question.

Transaction ledgerswho reached the Bank
Daily Bank Ratewhen stress became visible
Newspapers · Hansard · Bankers' Magazinewhen the public saw crisis
Yale Investor's Monthly Manualwhether access showed up as profit
1906 sterling bills reconstructionstructure of the access funnel
Römer 1931 reconstructioninterwar actor flow
BoE 1967 & 1978 Quarterly Bulletinlater institutional continuity
Discount-house database · 1976–96the layer still in use
The method pipeline

Scattered records into comparable clocks, networks, and scores.

Sources
ledger analysis
→
Clean & classify
counterparty classificationrecurrence analysis
→
Timing clocks
lead-time analysistext-mining visibility
→
Networks & funnel
concentration & funnelactor-flow networkstime-series summary
→
Continuity score
continuity-index scoring
→
Interpretation
price-proxy test
Each step turns one kind of record into something comparable across 150 years.
Result one · lead time

Stress was measurable before it was public.

A market-facing signal appears before the public rupture in every crisis. The lead is longest when trouble grew inside London finance.
Home-grown External shock
1866
288d
1847
277d
1890
142d
1907
68d
1857
25d
1914
1d
Lead in days, Bank signal to public rupture · from the project's lead-time table
Result two · the telegraph test

Prices became faster. Access did not become open.

The 1866 cable cut the London to New York price lag toward zero. If the City's advantage were only fast news, the lead should have shrunk.
1857 · before
25d
1907 · after
68d
New York London 1866 cable
Result three · actor recurrence

The firms changed. The access role persisted.

Union Discount
5
Overend, Gurney
3
Seccombe Marshall & Campion
2
Frith Sands
2
R. Raphael & Sons
2
Periods each firm appears near the front of the chain
Top 20 Bank counterparties in the 1866 acute windowTop counterparties at the Bank's window · 1866 ledger
Lender-of-last-resort continuity score by crisisContinuity score by crisis · a consistent mediated structure
Result four & conclusion

Mediated until 1997, not simply opened.

Bill brokers→Discount houses→Clearing-bank lifeboat→Authorised counterparties→1997 reform
The Bank's access network did not stay the same, but it also did not simply open. Crisis access remained mediated through recognised financial actors until 1997.
No profit claim: the Yale IMM price test shows no clear early listed-sector repricing.
Thank you
The British Access Network
Bank of England crisis access stayed mediated through recognised City firms, from Victorian bill brokers to authorised counterparties, 1847 to 1997.
Ananya Besufekad
Digital History

Speaker notes

1 / 8
Slide 1 / 8